
Monohybrid Cross Calculator
Use this monohybrid cross calculator to analyze one gene at a time. The preset starts with Aa × Aa and shows the exact genotypes before phenotype grouping.
Punnett square results
Illustrative symbols for each gene, not real species predictions. Pink = dominant, blue = recessive, purple = intermediate, pink + blue = codominant. Zoom in or expand large grids to see pictures.
| P1 ↓ P2 → | A | a |
|---|---|---|
| A | ||
| a |
Colors follow the selected view. Click a cell or result to highlight its group; labels and probabilities identify each group.
Analysis
Homozygous at every locus: 2/4 (50%)
Heterozygous at one or more loci: 2/4 (50%)
Parent 1 gametes · 2
Each gamete has probability 1/2.
Parent 2 gametes · 2
Each gamete has probability 1/2.
The grid shows the possible combinations for this model; it is a probability model, not a guarantee for one individual offspring.
Visual guide: the 2×2 monohybrid cross
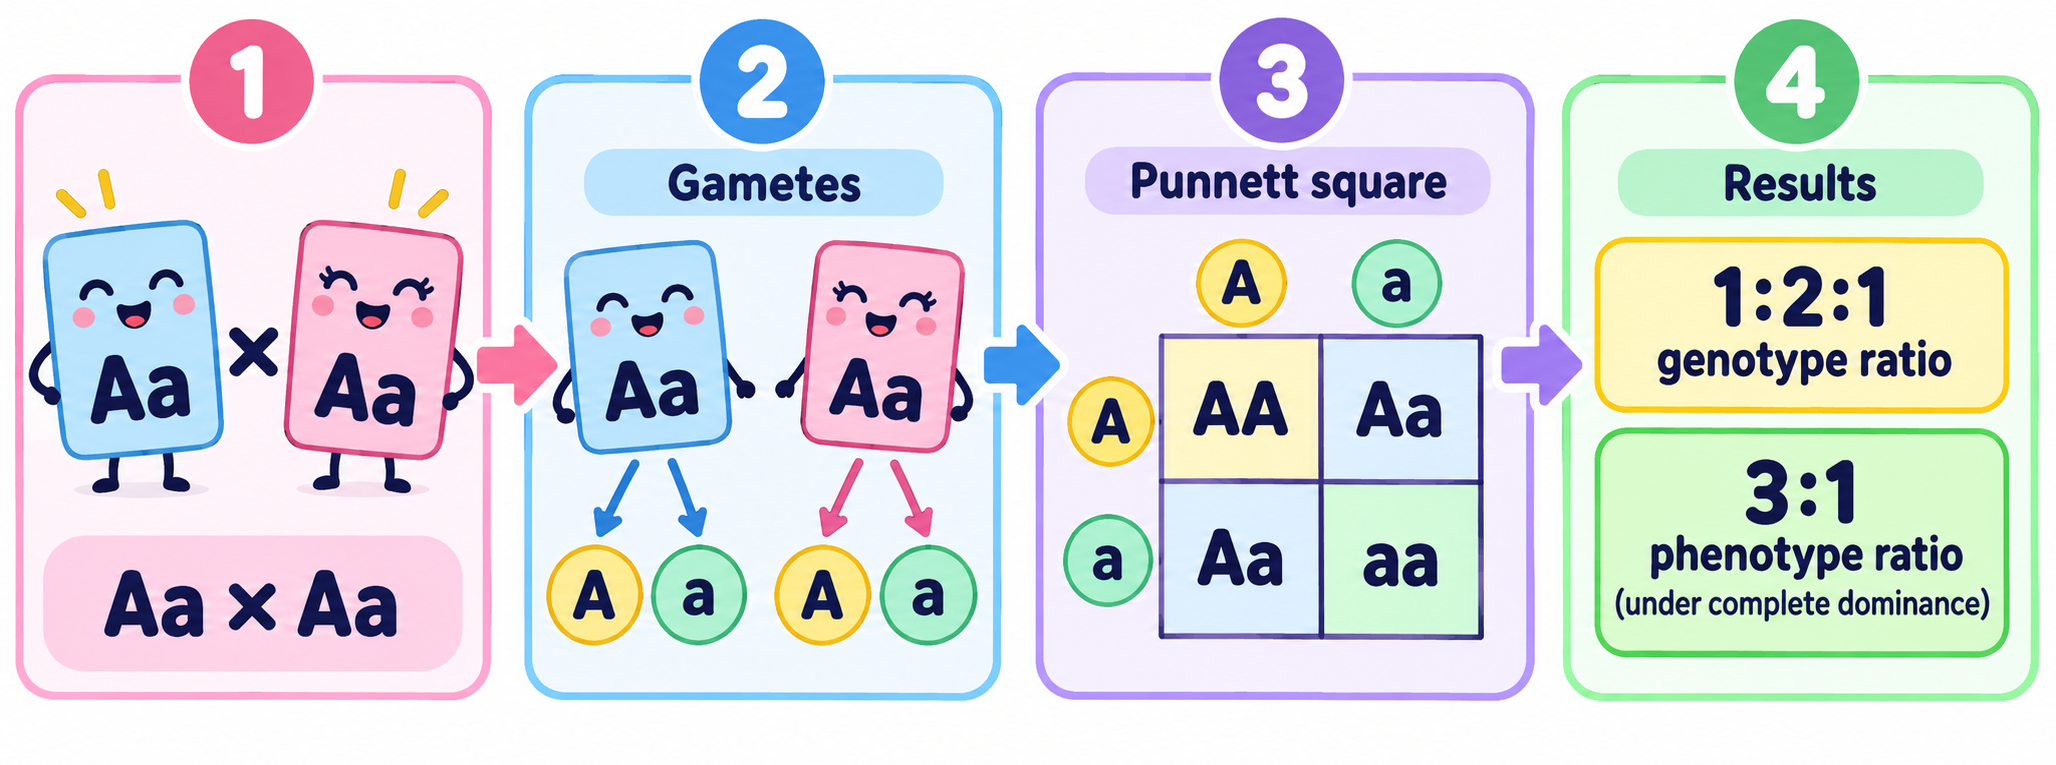
Complete dominance groups AA and Aa together: 3 dominant cells out of 4, or 75%, and 1 recessive cell, or 25%.
How to calculate a monohybrid cross
Use the 2×2 grid to connect each gamete combination to its probability.
- 1Each Aa parent separates its alleles into A and a gametes.
- 2Place A and a on each axis to create 2 × 2 = 4 cells.
- 3Fill the cells as AA, Aa, Aa, and aa. The matrix reports these exact genotypes.
- 4Count 1 AA, 2 Aa, and 1 aa: the genotype ratio is 1:2:1. Under complete dominance, the phenotype ratio is 3:1.
Checks for an Aa × Aa cross
1. Each heterozygous parent contributes A and a with equal probability in this simple model.
2. There are four cells: 1/4 AA, 2/4 Aa, and 1/4 aa.
3. Only complete dominance changes 1:2:1 genotypes into a 3:1 phenotype ratio.
A monohybrid result describes one modeled locus. It does not predict traits controlled by multiple genes or guarantee the outcome for one offspring.