
How to Make a Punnett Square
Learn the logic behind a Punnett square, then use the calculator above to check a monohybrid, dihybrid, or larger cross.
Visual guide: gametes become an exact genotype
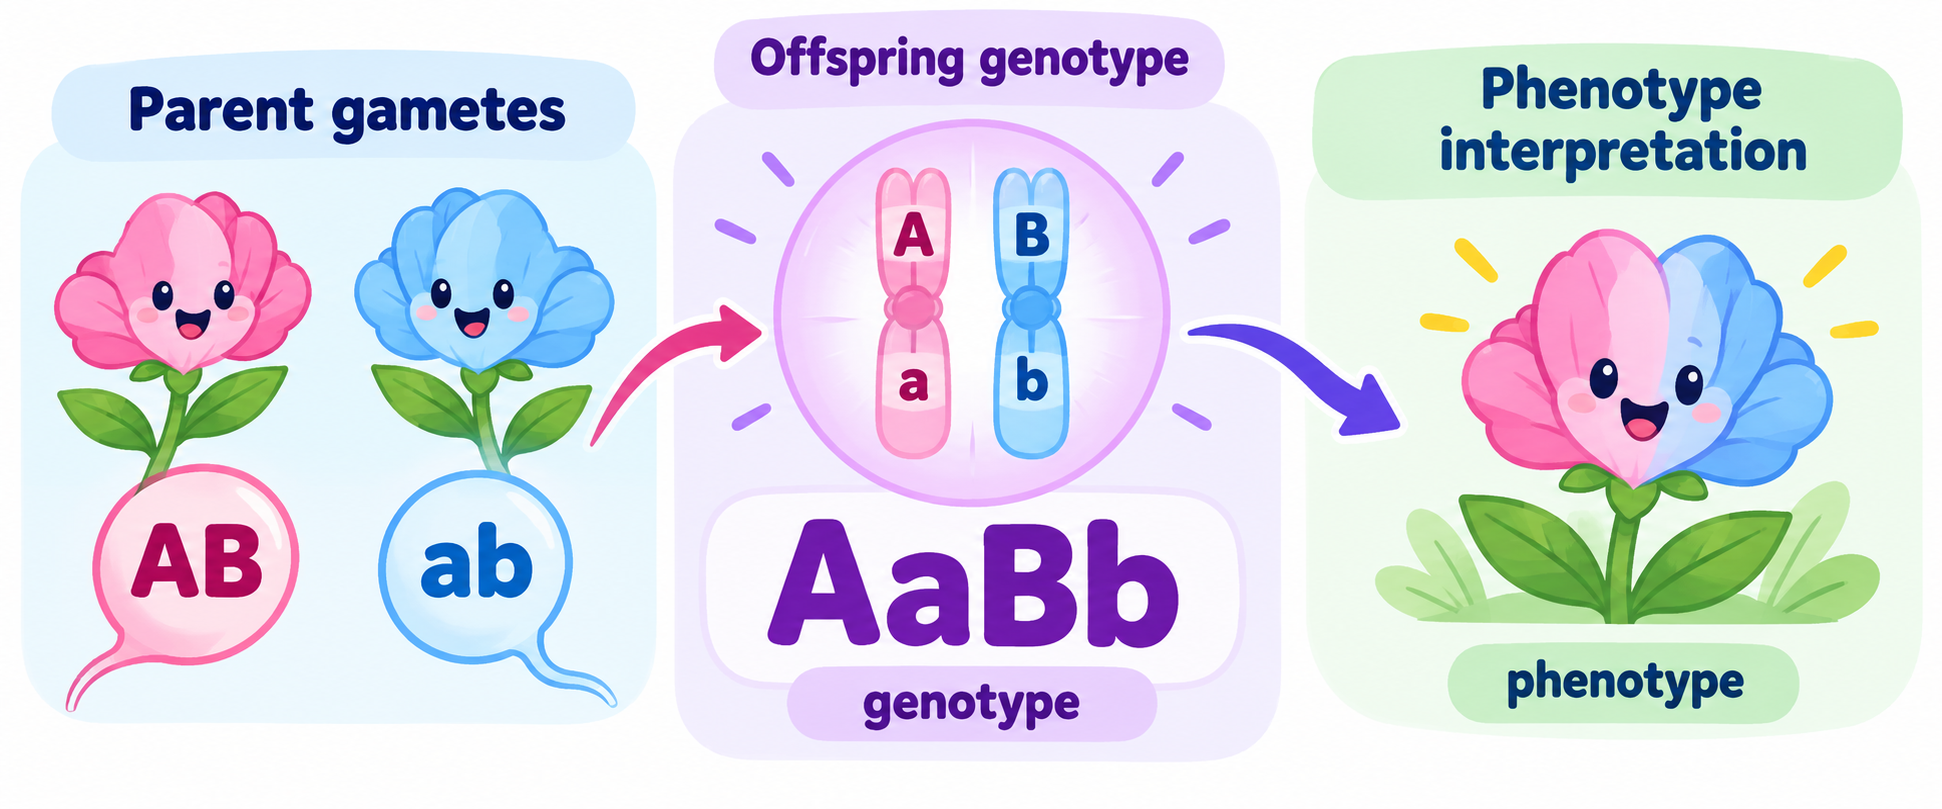
The cell is AaBb. A–B– is a later phenotype category under complete dominance; it is not a replacement for the genotype.
The four steps behind the calculation
The same process works for one trait or several independently assorting traits.
- 1Write one allele pair for each tracked locus in both parents. For example, AaBb means two loci: Aa and Bb.
- 2Separate the allele pairs into gametes. AaBb produces AB, Ab, aB, and ab because each gamete receives one allele from each locus.
- 3Put one parent's gametes on the rows and the other parent's gametes on the columns. Combine the alleles in every cell, keeping the exact offspring genotype, such as AaBb.
- 4Count repeated genotypes, divide by the total number of cells, and then group genotypes into phenotypes using complete dominance, incomplete dominance, or codominance.
Punnett square results
Illustrative symbols for each gene, not real species predictions. Pink = dominant, blue = recessive, purple = intermediate, pink + blue = codominant. Zoom in or expand large grids to see pictures.
| P1 ↓ P2 → | A | a |
|---|---|---|
| A | ||
| a |
Colors follow the selected view. Click a cell or result to highlight its group; labels and probabilities identify each group.
Analysis
Homozygous at every locus: 2/4 (50%)
Heterozygous at one or more loci: 2/4 (50%)
Parent 1 gametes · 2
Each gamete has probability 1/2.
Parent 2 gametes · 2
Each gamete has probability 1/2.
The grid shows the possible combinations for this model; it is a probability model, not a guarantee for one individual offspring.
What to check before trusting the result
1. The allele pairs are in the same locus order in both parents.
2. The number of cells equals the number of gametes on one axis multiplied by the number on the other axis.
3. Genotype counts are counted before any inheritance model groups them into phenotypes.
This page models simple autosomal Mendelian crosses. Linkage, sex-linked inheritance, multiple alleles, polygenic traits, and environmental effects need separate models.