
Trihybrid Cross Calculator
Use this trihybrid cross calculator to explore three independently assorting genes. The preset AaBbCc × AaBbCc produces an 8×8 grid with 64 cells.
Punnett square results
Illustrative symbols for each gene, not real species predictions. Pink = dominant, blue = recessive, purple = intermediate, pink + blue = codominant. Zoom in or expand large grids to see pictures.
| P1 ↓ P2 → | ABC | ABc | AbC | Abc | aBC | aBc | abC | abc |
|---|---|---|---|---|---|---|---|---|
| ABC | ||||||||
| ABc | ||||||||
| AbC | ||||||||
| Abc | ||||||||
| aBC | ||||||||
| aBc | ||||||||
| abC | ||||||||
| abc |
Colors follow the selected view. Click a cell or result to highlight its group; labels and probabilities identify each group.
Analysis
Homozygous at every locus: 8/64 (12.5%)
Heterozygous at one or more loci: 56/64 (87.5%)
Parent 1 gametes · 8
Each gamete has probability 1/8.
Parent 2 gametes · 8
Each gamete has probability 1/8.
The grid shows the possible combinations for this model; it is a probability model, not a guarantee for one individual offspring.
Visual guide: reading a large 8×8 grid
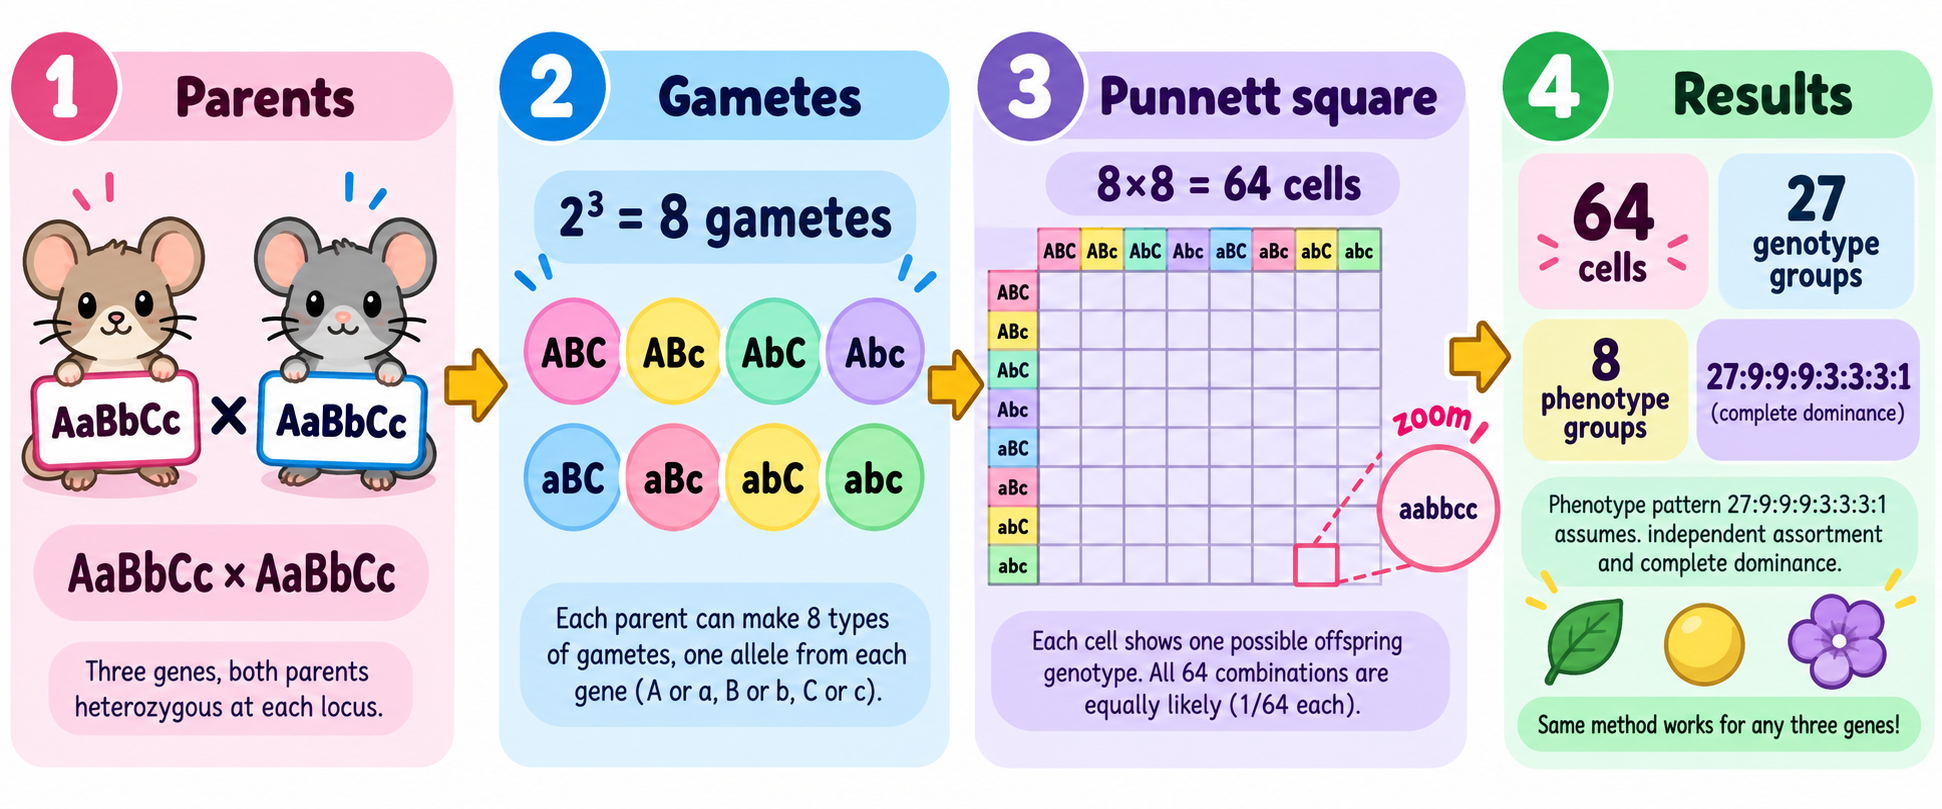
For complete dominance, the three-gene phenotype distribution follows the product of three 3:1 loci: 27:9:9:9:3:3:3:1, provided the loci assort independently.
How to calculate a trihybrid cross
Each additional independently assorting locus doubles the number of possible gametes for a heterozygous parent.
- 1Split AaBbCc into one allele choice at each of three loci.
- 2List the 2³ = 8 gametes: ABC, ABc, AbC, Abc, aBC, aBc, abC, and abc.
- 3Combine the eight row gametes with the eight column gametes to create 8 × 8 = 64 exact offspring genotypes.
- 4Use the result summary to count genotype groups and model phenotype groups. Expand and zoom the grid when you need to inspect individual cells.
Checks for an AaBbCc × AaBbCc cross
1. Each parent produces 2³ = 8 gametes because three loci are heterozygous.
2. The grid contains 8 × 8 = 64 equally likely cells, even though many cells repeat the same genotype.
3. The 27:9:9:9:3:3:3:1 pattern is a complete-dominance result under independent assortment.
An 8×8 square is a teaching model, not a guarantee for one organism. Use the zoom and expanded view to audit cells, and use a separate model for linkage or sex-linked inheritance.