
Punnett Square Generator
Punnett square results
Illustrative symbols for each gene, not real species predictions. Pink = dominant, blue = recessive, purple = intermediate, pink + blue = codominant. Zoom in or expand large grids to see pictures.
| P1 ↓ P2 → | A | a |
|---|---|---|
| A | ||
| a |
Colors follow the selected view. Click a cell or result to highlight its group; labels and probabilities identify each group.
Analysis
Homozygous at every locus: 2/4 (50%)
Heterozygous at one or more loci: 2/4 (50%)
Parent 1 gametes · 2
Each gamete has probability 1/2.
Parent 2 gametes · 2
Each gamete has probability 1/2.
The grid shows the possible combinations for this model; it is a probability model, not a guarantee for one individual offspring.
Use this Punnett square generator and calculator to build a cross from two parent genotypes and see exact offspring genotypes, phenotype groups, genotype ratios, and phenotype ratios.
Make a monohybrid, dihybrid, or trihybrid Punnett square — and extend the same workflow to one through five independently assorting genes. Inspect gametes, check the 4×4 grid for two traits, then download or share the result.
How to use this generator
- 1
Choose the cross
Choose one to five genes. One gene creates a monohybrid cross, two genes create a dihybrid cross, and three genes create a trihybrid cross. Changing the count loads a heterozygous example for both parents.
- 2
Enter both genotypes
Enter one allele pair per locus, keeping the same gene order in both parents.
- 3
Select the model
Choose complete dominance, incomplete dominance, or codominance to group the outcomes.
- 4
Read and copy
Check the exact genotype in each cell, then compare genotype ratio, phenotype ratio, and percentages. Copy or download the Punnett square when you are ready.
How a Punnett square works
A Punnett square is a probability table for a genetic cross. It does not look at one guaranteed offspring; it lists every equally likely combination of gametes under the selected model. To calculate a result, first split each parent's allele pairs into gametes, then combine one gamete from each parent, and finally count how often each genotype appears.
At one locus, a parent with AA can make only A gametes, aa can make only a gametes, and Aa can make A or a gametes. With several independently assorting loci, take one allele from every pair and list every possible combination. For AaBb, the gametes are AB, Ab, aB, and ab.
Place one parent's gametes across the top and the other parent's gametes down the side. Fill a cell by joining the alleles from its row and column. For example, A from one parent plus a from the other gives Aa; in a two-gene cross, Ab plus aB gives AaBb after each locus is put back in its pair.
If there are g₁ gametes from parent 1 and g₂ from parent 2, the grid has g₁ × g₂ equally likely cells. Count the cells with each genotype, then divide by the total number of cells. In a 4-cell Aa × Aa grid, AA appears once, Aa twice, and aa once, so the probabilities are 1/4, 2/4, and 1/4 — or 25%, 50%, and 25%.
A genotype is the allele combination; a phenotype is the observable category assigned by the chosen model. Under complete dominance, AA and Aa are grouped together, giving 3 dominant : 1 recessive in Aa × Aa. Under incomplete dominance, AA, Aa, and aa remain three phenotype groups. Under codominance, both alleles are represented in the heterozygote.
Read the result in two layers. The genotype view reports the exact allele combinations and their probabilities. The phenotype view applies the selected inheritance rule and combines genotypes that produce the same modeled trait. The counts should always add to the total number of grid cells, and the percentages should add to 100% apart from rounding.
Aa × Aa → 1 AA : 2 Aa : 1 aa
For Aa × Aa, the genotype count is 1 AA + 2 Aa + 1 aa = 4 cells. With complete dominance, AA and Aa are both dominant, so 1 + 2 = 3 dominant cells and 1 recessive cell: 3:1, or 75%:25%.
From gametes to a complete genotype
The matrix always records the offspring genotype first. In a dihybrid cross, an AB gamete from one parent and an ab gamete from the other combine to make AaBb. The phenotype label is a separate interpretation added after the genotype is calculated.
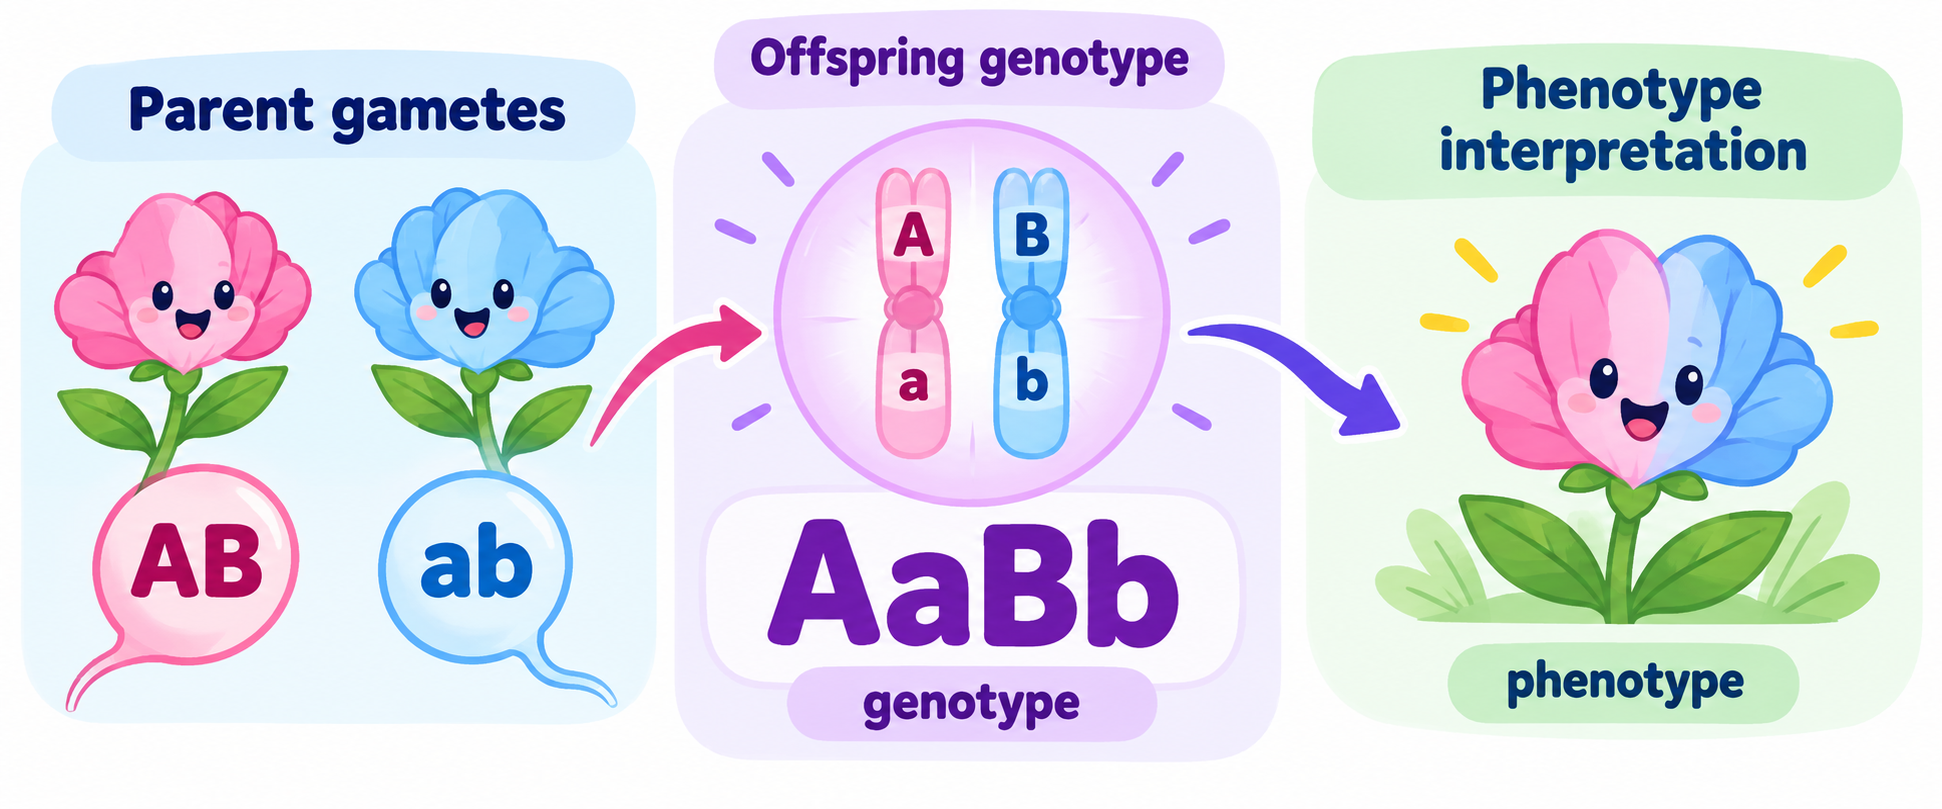
Read each cell from left to right: parent gametes → exact offspring genotype → modeled phenotype.
Worked examples
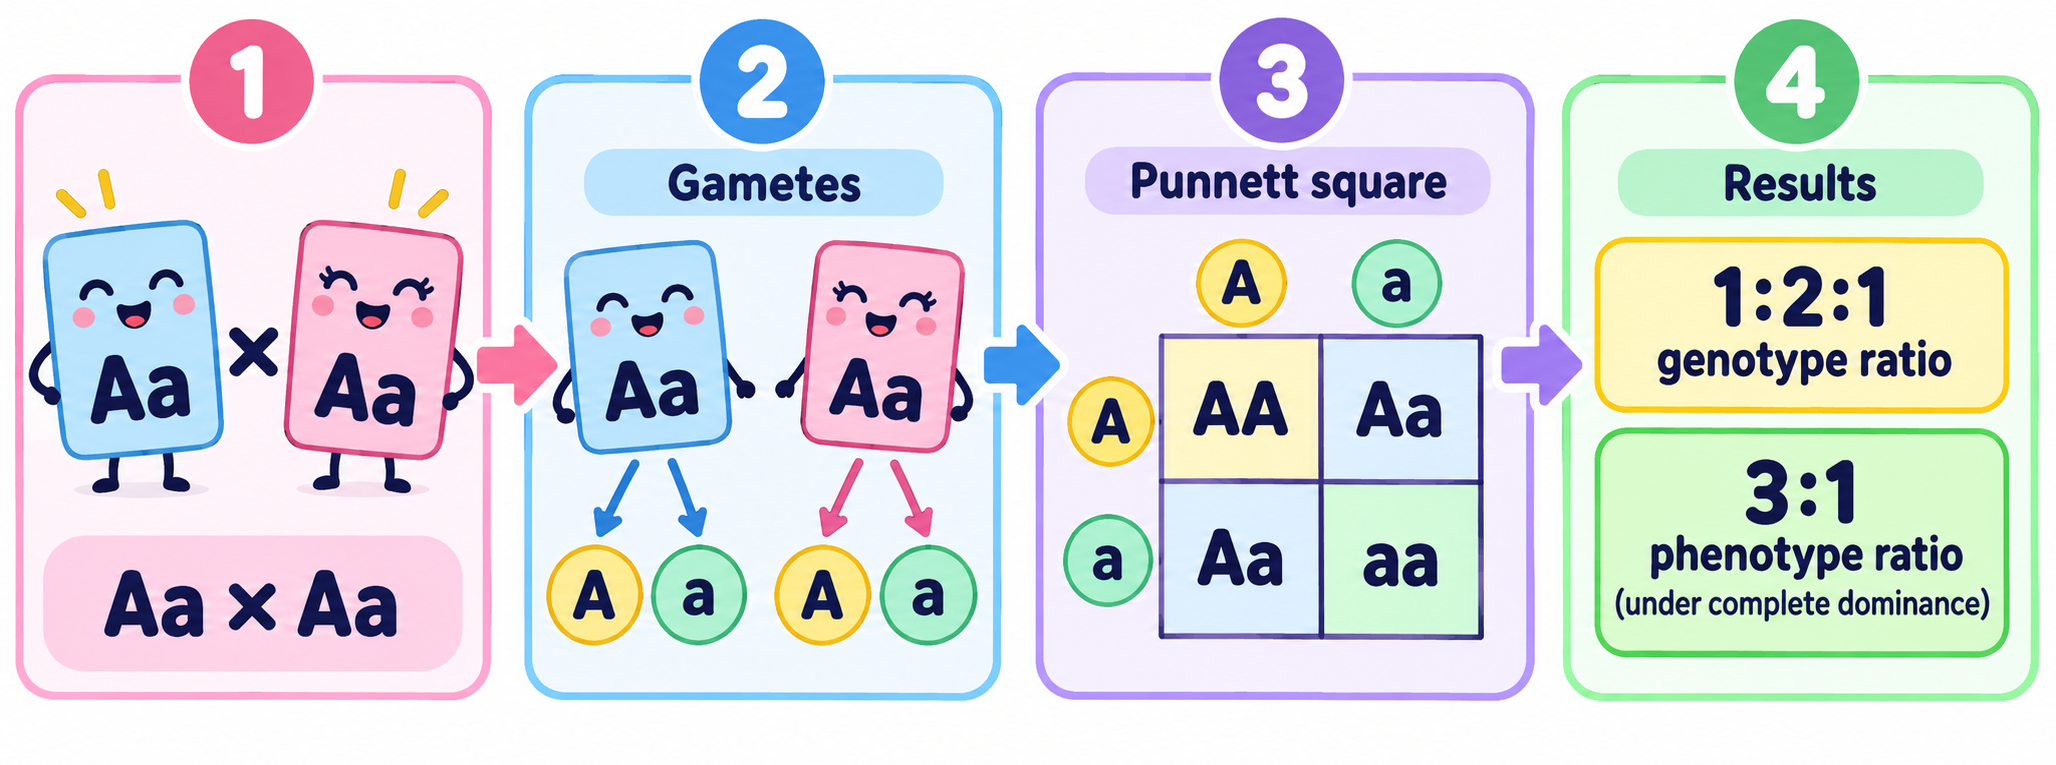
Follow the four steps below to turn the Aa × Aa cross into genotype and phenotype ratios.
- Each Aa parent produces two gametes: A and a. There are 2 × 2 = 4 equally likely cells.
- Combine the gametes cell by cell: A + A = AA, A + a = Aa, a + A = Aa, and a + a = aa.
- Count exact genotypes: 1 AA : 2 Aa : 1 aa, which is 25% : 50% : 25%.
- With complete dominance, AA and Aa share one phenotype, so 1 + 2 = 3 dominant cells versus 1 recessive cell: 3:1. With incomplete dominance or codominance, the phenotype ratio remains 1:2:1.
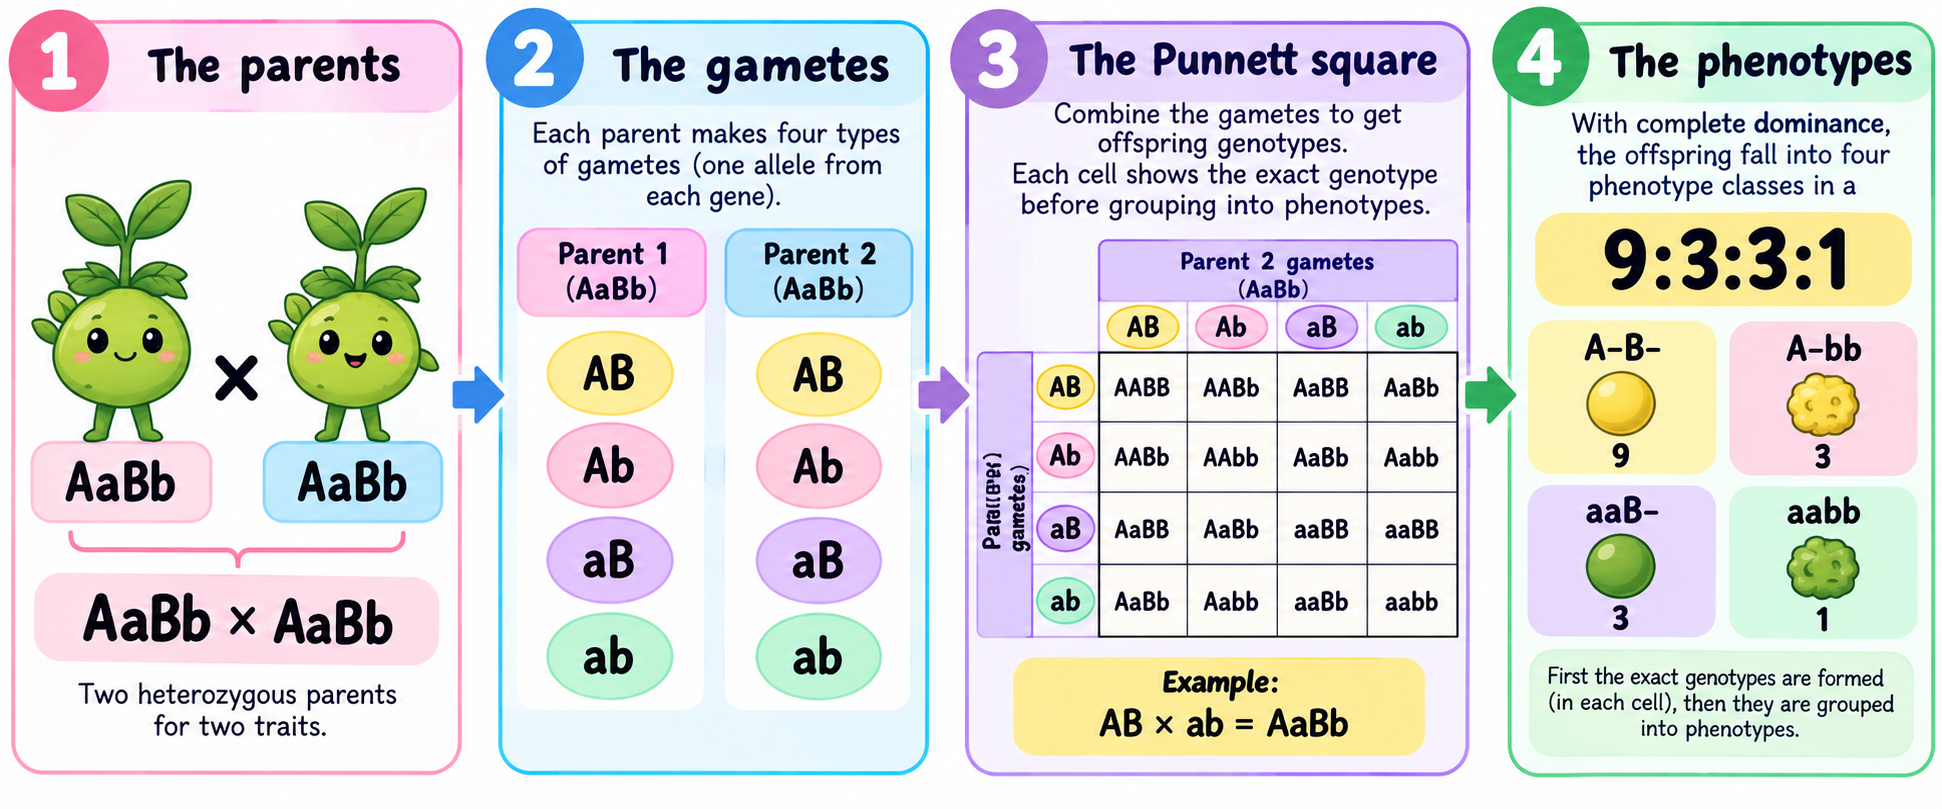
Follow the four steps below to build a 4×4 grid and separate exact genotypes from phenotype groups.
- Each AaBb parent produces AB, Ab, aB, and ab. Four gametes on each axis create a 4×4 Punnett square with 16 cells.
- Combine each row gamete with each column gamete. For example, AB × ab produces the exact offspring genotype AaBb — not A– B–.
- Under complete dominance, group the 16 exact genotypes by phenotype: 9 have A–B–, 3 have A–bb, 3 have aaB–, and 1 has aabb.
- The phenotype ratio is 9:3:3:1, or 56.25%:18.75%:18.75%:6.25%. This classic result requires independent assortment and complete dominance.
Assumptions and limits
This page models simple Mendelian crosses and is intended for learning, planning, and checking textbook-style problems.
- Dihybrid results assume the tracked loci assort independently; linked genes can produce different ratios.
- The model does not predict complex or polygenic traits that also depend on other genes or the environment.
- A probability is not a promise for one child or organism, and this tool is not medical or paternity advice.
Punnett square questions
What does a Punnett square calculate?
It estimates the possible genotype combinations and expected phenotype proportions from the parent genotypes entered. It does not identify the exact outcome of one individual offspring.
What is the difference between genotype and phenotype?
A genotype is the allele combination, such as Aa. A phenotype is the trait category associated with that genotype under a chosen inheritance model.
Why do I need to keep the gene order the same?
The first pair represents one locus and the second pair represents the next locus. Reordering one parent would make the tool combine different loci as if they were the same gene.
Can I use this for blood type or X-linked inheritance?
Not in this version. Blood type uses multiple alleles and X-linked inheritance depends on sex chromosomes, so those cases need their own models rather than the standard autosomal grid.
What does incomplete dominance change?
It keeps the heterozygous genotype as a separate intermediate phenotype instead of grouping it with the dominant homozygote.
Why might a real result differ from the percentage?
The percentages are expected probabilities. Small family or breeding groups can deviate by chance, and real traits may involve linkage, additional genes, incomplete penetrance, or environmental effects.
What is a 4×4 Punnett square?
A 4×4 Punnett square is the usual grid for a dihybrid cross when each parent can make four gametes, such as AB, Ab, aB, and ab. It contains 16 possible gamete combinations.
How do I find the genotype ratio and phenotype ratio?
First count exact genotypes in the cells to get the genotype ratio. Then apply the inheritance model to group those genotypes into phenotype categories and count those groups separately.
Continue learning
Use the calculator for the cross, then browse the wider calculator hub or learning resources when you need a different workflow.